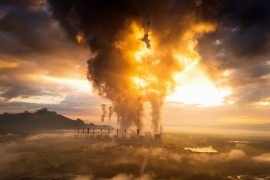
Worsening global heatwaves linked to the fossil fuel industry
Last summer felt different across large parts of Europe and the Mediterranean. Temperatures broke local records, forests dried out, and daily life bent under relentless heat.
A new study goes further than asking whether climate change played a role. It quantifies how much specific fossil fuel and cement producers contributed to 213 major heatwaves from 2000 to 2023.

The team examined heatwaves reported by governments and media because they caused serious losses or triggered emergency help.
Researchers analyzed whether human-driven warming made those events more likely or more intense, then linked those changes to emissions from 180 large producers known as “carbon majors.”
The real costs of heat
Heatwaves are not just uncomfortable. They threaten health, strain power grids, and hit farms and factories with real economic pain.
Connecting events to sources provides a clearer picture of responsibility than broad national averages.
The study answers two questions: first, how much has climate change amped up these events, and second, how much did each company’s emissions add to that amplification.
Heat waves and climate change
An attribution study estimates how climate change shifts the odds and severity of an extreme event. Scientists compare the world we live in with a modeled preindustrial baseline to quantify the difference.
They use global mean surface temperature as a yardstick for how much the planet has warmed overall. A probability ratio tells you how many times more likely an event became compared with the historical world before major industrial emissions.
Across all 213 heatwaves, climate change increased both the intensity and the likelihood. The median boost in intensity rose from about 1.4 °C (2.5 °F) in 2000 to 2009 to about 2.2 °C (4.0 °F) in 2020 to 2023, which matches the broader warming trend reported over land surfaces.
The odds jumped as well. Heatwaves became about 20 times more likely during 2000 to 2009 and about 200 times more likely during 2010 to 2019 compared with 1850 to 1900.
Fossil fuel companies and heatwaves
The authors traced heatwave contributions from the 180 largest fossil fuel and cement producers. Those emissions account for a major share of historical carbon dioxide and methane released into the atmosphere.
Fourteen entities stand out because their total contribution to warming matches that of the other 166 combined. That pattern shows scale matters, but smaller producers still matter, since even modest shares can push rare events over the edge.
Past research often grouped emissions by country or individual. This work focuses on firms because they extract and sell products with high carbon footprints and have steered business strategies in light of what they knew about climate risks.
The paper highlights that companies have pursued profit within systems that long undervalued climate costs. That context may inform debates about responsibility, insurance, and how to fund adaptation.
Tracing extreme heat events
First, the team applied an established event attribution protocol maintained by World Weather Attribution. The approach compares observed temperatures during each heatwave to a modeled preindustrial world, tests statistical fit, and combines multiple lines of evidence.
Second, they used an Earth system model to calculate how each carbon major’s emissions changed global temperature over time. Removing one entity’s emissions from the historical record in a model run shows the temperature difference that producer made.
Take the Pacific Northwest heat dome of June 2021. Analyses found human induced warming increased its intensity by several degrees Celsius (roughly 4-9 °F) and made such an event far more likely than it would have been before industrialization.
The new study used a similar framework consistently across the world’s continents. That consistency allows a fairer comparison among many events rather than a handful of famous ones.
Corporate share of heat
The researchers estimate that about half of the increase in heatwave intensity since preindustrial times can be traced to the carbon majors. Median contributions from the top group to the intensity of these events range up to a few tenths of a degree Celsius (about 0.5 °F).
Some heatwaves would have been virtually impossible without the added warming. The authors report that dozens of events cross that threshold when considering the total human effect.
“It just shows that it’s not that many actors … who are responsible for a very strong fraction of all emissions,” said Sonia Seneviratne of ETH Zurich (ETHZ).
That perspective reflects the study’s focus on tracing causal chains from producers to real world impacts. It does not erase individual or national roles, but it sharpens the picture of who profits directly from high emitting activity.
Limitations and open questions
Reporting gaps in Africa and parts of South America mean some heatwaves did not make it into the dataset. That undercounts risk in regions that are warming rapidly and often have fewer resources to cope.
Attribution can also be harder for very rare events and where observational records are shorter. Still, the paper documents careful checks on model performance and statistical causality to build confidence in the results.
Heat’s toll on society
Heat risk scales with age, outdoor work, housing, and access to cooling. Better early warning, more shade, and grid upgrades reduce harm now, even as long term solutions tackle emissions.
The legal and policy landscape may shift as attribution strengthens. Courts, regulators, and insurers are already weighing how to assign costs when heat pushes systems beyond design limits, and when losses stack up across sectors.
Connecting science to action
For students and the public, this study shows how scientific tools connect dots from physics to policy. It uses transparent data, multiple models, and clear statistical tests to answer questions many communities are already asking.
It also shows that choices by concentrated actors can have global effects. Understanding that chain helps people think more clearly about accountability and investment.
Researchers plan to apply the same framework to other extremes, including heavy rain, drought, and wildfires. Each hazard will bring its own statistical wrinkles and data needs.
As methods evolve, expect sharper estimates and more open datasets. That progress will help cities, health systems, and courts make decisions that match the scale of the risk.
The study is published in the journal Nature.
—–
Like what you read? Subscribe to our newsletter for engaging articles, exclusive content, and the latest updates.
Check us out on EarthSnap, a free app brought to you by Eric Ralls and Earth.com.
—–


News coming your way